Assignment 2
This - and all subsequent - assignment must be done using R Markdown Notebooks (a feature of R Studio). Be sure to properly "chunk" your code and add copious comments to each chunk. Make it clear which question you are answering, e.g., Question 1.2 means first question, second part. Each chunk should accomplish a small well-defined analysis task.
Question 1 (10 Points)
- Using the built-in dataset USArrests in R (containing statistics about violent crime rates in the US States), create the following visualization using ggplot2. See the resources below for help.
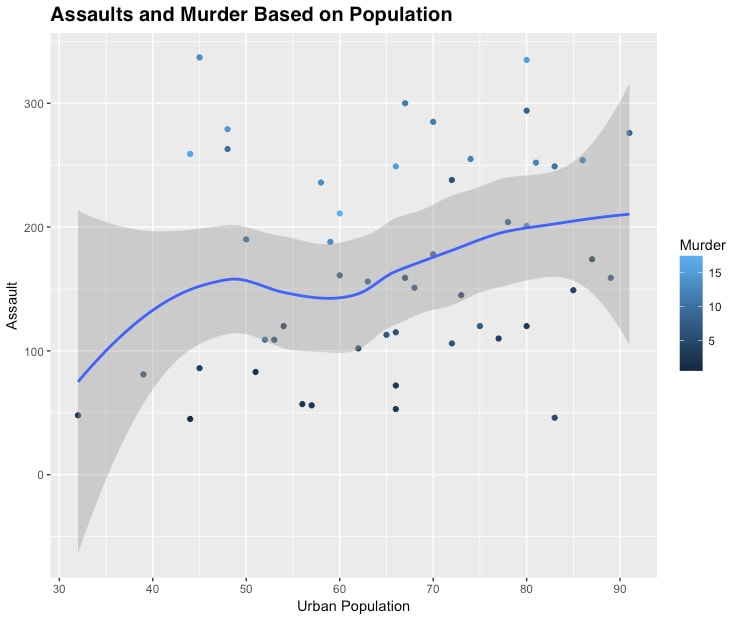
Note that the x axis label is a custom string and that the title of the chart is in a 15 point bold Helvetica (Mac) or Arial (Windows) font.
Question 2 (10 Points)
- For the same data set as in Question 1, determine which states are outliers in terms of assaults. Outliers, for the sake of this question, are defined as values that are more than 1.5 standard deviations from the mean.
- For the same dataset, is there a correlation between murder and assault, i.e., as one goes up, does the other statistic as well? Comment on the strength of the correlation. Calculate the Pearson coefficient of correlation in R.
Question 3 (10 Points)
- Download the data set surveys.csv and load it into R using surveys <- read.csv("surveys.csv", header = T, sep = ","). This loads the data into the surveys data frame.
- Calculate the mean length of the hind foot for the species.
- Calculate the proportion of male and female species as a percentage, e.g., 43% male, 57% female.
- Create a scatter plot of hind foot length versus weight. Comment on any correlation that is visually apparent, then calculate the correlation coefficient and comment on the strength of the correlation.
The fields in the data table are the following:
- Record_id : a unique number for each row in the table
- Month : Month when the observation was made
- Day: Calendar day the observation was made
- Year: Year the observation was made
- Plot_id: the area the measurement was taken
- Species_Id: species id, please see https://github.com/weecology/portal-teachingdb/blob/master/species.csv for more information
- Sex: sex of the observation Male or Female
- Hindfoot: length of the hindfoot
- Weight: weight of the animal
Question 4 (30 Points)
- Extract the survey observations for the first three months of 1990 using the filter() function using the dyplr package.
- Sort the 1990 winter surveys data by descending order of record ID, then by ascending order of weight. Winter is defined as the months January, February, and March.
- Extract the record_id, sex and weight of all "Reithrodontomys Montanus" (RO).
- What is the average weight and hindfoot length of "Dipodomys Merriami" (DM) observed in each month (irrespective of the year). Make sure to exclude NA values.
- Determine the number of cases (observations) by species observed in the winter of 1990.
Question 5 (40 Points)
- Install the gapminder package in R and load the gapminder dataset. The gapminder data is not a data frame, you need to use the as.data.frame() function to convert it to one. The fields on the data frame are the following:
Country: the country the statistics are collected for
Continient: the continent where the country resides
Year: the year when the statistics were collected
LifeExp: the life expectancy for a person living in that country in that particular year
pop : the population for the country in that particular year
gdpperCap: the GDP per capita (person) GDP is gross domestic product, the total economic output of a country, i.e., the amount of money a country makes. GDP per capita is the total output divided by the number of people in the population. This measure provides an average output of each person, i.e., the average amount of money each person makes. - Create a dataframe named gapminder_df and mutate it to contain a column that contains the gross domestic product for each row in the data frame.
- Calculate the Mean GDP for Cambodia for the years within the dataset.
- Find the year with the maximum life expectancy for countries in Asia and arrange them in descending order by year, The result should contain the country’s name, the year and the life expectancy.
- Count the number of observations per continent.
- Compute the average and median life expectancy and GDP per capita by continent for the years 1952 and 2007. Should we be optimistic given the results?
Useful Resources
Submission Details
- Your submission must contain two files: the .Rmd notebook and a knitted PDF or HTML (from the notebook). Name your .Rmd R Notebook, DA5020.A2.LastName.Rmd and your PDF/HTML DA5020.A2.LastName.{pdf,html}, where LastName is *your* last name.
- The .Rmd file must be fully commented and properly "chunked" R code and detailed explanations. Make sure that it is easy to recognize which question you answer and that your code runs from beginning to end (because that is how we will test it.) Code that doesn't execute, stops, throws errors will receive -- naturally -- receive no points. If the graders have to "debug" your code or spend any effort getting it to run, substantial points will be deducted.
- Not submitting a knitted PDF or HTML will result in reduction of 30 points.
- Not submitting the .Rmd file (or both) will result in a score of 0.
