Assignment 5
This week’s assignment is about tidying up the structure of data collected by the US census. Load the Unemployment and Educational data files into R studio. One file contains yearly unemployment rates from 1970 to 2015, for counties in the US. The other file contains aggregated data percentages on the highest level of education achieved for each census member. The levels of education are: “less than a high school diploma”, “high school diploma awarded”, “attended some college”, “college graduate and beyond”. The census tracks the information at the county level and uses a "fips" number to represent a specific county within a U.S. state. The fips number is a 5 digit number where the first two digits of the fips number represents a U.S. state, while the last three digits represent a specific county within that state.
Problem 1 (10 Pts)
Download the unemployment and education data files below and save the files to your working directory folder. Load both the unemployment data and the education data into R. Review the education data. Identify where variable names are actually values for a specific variable. Identify when multiple rows are data for the same entity. Identify when specific columns contain more than one atomic value. Tidy up the education data using spread, gather and separate.
Problem 2 (15 Pts)
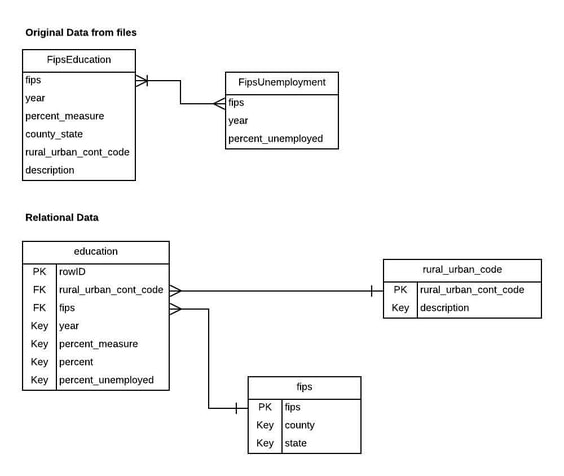
Break apart the education data into three distinct tibbles. One tibble named education contains the education data, another tibble named fips, contains the fips number definition, and the third tibble named rural_urban_code contains the textual description of the 9 different urban to rural data descriptions. These three tibbles must be linked together to represent the relationships between the tibbles. For example, in the fips table each row represents the definition of a fips number (County, State). Each row in the education table will contain the educational attainment of a specific county. It also will contain a fips number since this data is specific to a county within a state. There are fips numbers for the state at large rather than a county -- omit those from the tibbles. Here's an entity-relationship diagram of the model:
Problem 3 (15 Pts)
Answer the following questions about your tibbles: The fips column in the education table - is it a foreign or a primary key for the education tibble? What is the primary key for your education tibble? The rural_urban_code tibble should only contain 9 rows. What is its primary key?
Problem 4 (40 Pts)
Write expressions to answer the following queries:
- In the year 1970, what is the percent of the population not attaining a high school diploma for the Nantucket county in Massachusetts? What about the year 2015?
- What is the average percentage not receiving a high school diploma for the counties in Alabama for the year 2015? Calculate the value, do not use the rate provided in the FipsEducation file.
- What is the average percentage of college graduates for the counties in the state of Alaska for the year 2015?
- Determine the average percentage of population not attaining a high school diploma for the counties in Alabama for each year within the dataset. The result should return the calendar year and the average percentage not attaining a high school diploma for that year?
- What is the most common rural_urban code for the U.S. counties?
- Which counties have not been coded with a rural urban code? Return a result that contains two fields: County, State for the counties that have not been assigned a rural urban code. Do not return duplicate values in the result. Order the result alphabetically by state. What does this result set represent?
- What is the minimal percentage of college graduates for the counties in the state of Mississippi for the year 2015? What does the result represent?
- In the year 2015, which fip counties, are above the average unemployment rate? Provide the county name, U.S. state name and the unemployment rate in the result. Sort in descending order by unemployment rate.
- In the year 2015, which fip counties in which U.S. states contain a higher percentage of unemployed citizens than the percentage of college graduates? List the county name and the state name. Order the result alphabetically by state.
- List the county, U.S. state and year that contains the highest percentage of college graduates in this dataset?
Problem 5 (10 Pts)
This is an open-ended question: explore the unemployment rate and the percent not attaining a high school diploma over the time period in common for the two datasets. What can you discover? Create at least one plot, chart, or graph that supports your discovery.
Problem 6 (20 Pts)
- Load the XML document at the URL (https://www.senate.gov/general/contact_information/senators_cfm.xml) directly into a data frame.
- Write a function senatorName(state) that returns the names of the senators for a given state, i.e., the function takes a state as an argument and returns the names of the senators for that state in a vector. The names must be in the form last, first, e.g., Lamar, Alexander with any additional name elements such as III or Jr. or Sr. removed.
Submission Details
- Your submission must contain two files: the .Rmd notebook and a knitted PDF or HTML (from the notebook). Name your .Rmd R Notebook, DA5020.A5.LastName.Rmd and yyour PDF/HTML DA5020.A5.LastName.{pdf,html}, where LastName is *your* last name.
- The .Rmd file must be fully commented and properly "chunked" R code and detailed explanations. Make sure that it is easy to recognize which question you answer and that your code runs from beginning to end (because that is how we will test it.) Code that doesn't execute, stops, throws errors will receive -- naturally -- receive no points. If the graders have to "debug" your code or spend any effort getting it to run, substantial points will be deducted.
- Not submitting a knitted PDF or HTML will result in reduction of 30 points.
- Not submitting the .Rmd file (or both) will result in a score of 0.
Data Files
